Table of Contents

“2016 was a failure of the imagination, not a failure in data”

– Matthew Shelter, Fox News Pollster

Official Polls Converging with High Frequency Data

As we draw closer to November 3rd, the past week has seen some top outlets (NY Times/Fox News) released a series of polls suggesting the Trump campaign has fallen further behind in the key battleground states. With the current momentum in the polls we believe a Biden landslide (10% or more) victory is an increasing likely outcome.

To reflect the shifting election probabilities, most Wall Street economists have revised (up) their US economic projections – with expectations of an addition $1 trillion stimulus spending under a Democrat senate majority. Meanwhile, Facebook marked a first in removing a coronavirus related post by the President citing ‘a newly introduced policy that may take some time to enforce more broadly across its platforms'.

Data Blind Spots for 2020
As the world of business and finance adjusts to the evolving election probabilities, we attempt to identify data blind spots which may lead to polling errors. In the aftermath of the 2016 US Presidential Election mishaps, a narrative emerged laying the ‘shock' result largely attributable to a ‘hidden Trump vote'. Whilst this narrative is convenient, it is only partially accurate and fails to fails to capture the deeper rooted polling assumptions. Notably, a heavy reliance on National Vs State polls to make election forecasts – see the Electoral College. With the benefit of hindsight, the 2020 pollsters have almost entirely focused on a state-by-state approach to produce their final outcome predictions.
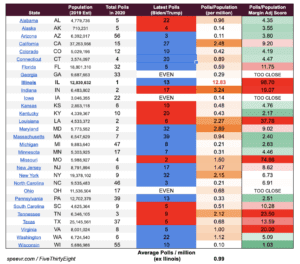
The table below shows aggregate polling data for states with a population of 5 million or more, as well as others with recent media coverage.
US Presidential Election Series 2020 | Speevr
Using data provided by FiveThirtyEight, we tally up total number of polls conducted so far in 2020 across all pollsters with at least a ‘B' grade according to Nate Silver. The column ‘Latest Polls (Biden/Trump)' represents in blue or red the lead each candidate has in points (%) within each state according to the latest polls published. We normalise the state population according to the total number of polls conducted (year-to-date). i.e. the number of polls per million population .Thus, are able to deduce a very simple population adjusted statistical risk score which takes into consideration a candidates relative lead by state. The risk scores are calculated in the final column – ranging from Green (low) to Red (high) risk in polling uncertainty.
We conclude the following:
  1. The key/battleground states which have been too close to call have ~ 10 times more polls conducted than others. Through intense polling in a handful of keys states, we are unlikely to witness any major polling upsets in those states.
  2. Some traditionally red/blue states have received very limited state-level polling  – presenting greater risk of an unexpected outcome. For example, CA,FL, IN, IL, LA, MO, TN, and VA States, as compared to Wisconsin (WI) with a population of 5.6 million and 55 reported polls year-to-date.
  3. Not captured in the table above – the top ranked pollsters focusing almost exclusively on the key battleground states. Consequently, many less significant states have less up-to-date polling date, and of lower quality. Illinois has been polled just one-time in mid-summer 2020 where Biden was leading by +13%.
Subscribe to receive updates from Speevr

More recent

Share this page

Speevr logo

US Presidential Election Series 2020

“2016 was a failure of the imagination, not a failure in data” – Matthew Shelter, Fox News Pollster Official Polls Converging with High Frequency Data