Speculative FX trading was the key feature of Japanese retail investors. No more. Buy-and-hold strategy has become is mainstay. I explain the arc of Japanese retail investors over the last 5 decades
Key takeaways
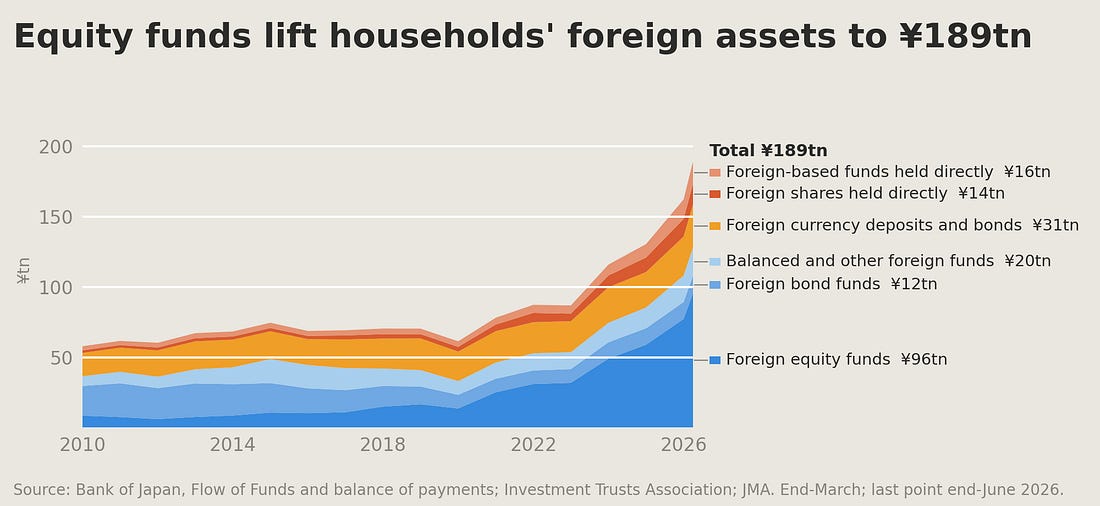
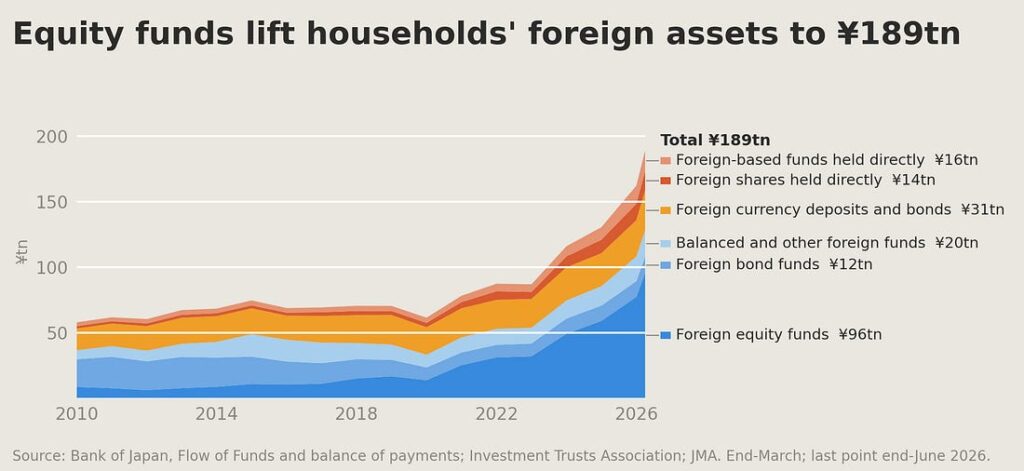
Mrs Watanabe no longer represents Japan’s retail investors. Only ¥1.9 trillion sits in retail FX margin accounts, 1% of households’ ¥189 trillion of foreign assets at the end of June 2026. In comparison, investment funds that target foreign equity took in ¥15.4 trillion in the 12 months to August 2026.
The young are the most committed to the buy-and-hold strategy. The introduction of NISA, a preferential tax framework for small-scale retail investors, is one of a few factors behind the change in their investment behavior.
From real estate to financial assets. Through the 1980s-90s, households’ wealth was locked in land, 54% of their assets in 1990 against 21% now. Japanese households now allocate as large a share of their assets to financial assets as their counterparts in the US.
Rising bond yields are starting to pull money into fixed income. Retail JGB sales are setting monthly records. Japanese households are also starting to shift their bank deposits into time deposits.
Who is Mrs Watanabe, and who replaced her
Mrs Watanabe is one of the most ubiquitous names in Japan, equivalent to Mrs Jones in the US. For those following Japanese financial news, however, Mrs Watanabe has been used to describe a typical retail investor in Japan. The Economist magazine used it in 1997 to describe a housewife chasing yield in yen bonds issued by foreign borrowers. When speculative retail FX trading was liberalized in 1998 and became popular in Japan in the 2000s, Mrs Watanabe became a synonym for the retail FX speculator who bets on the rise and fall of currencies.
While the cohort of speculative retail FX investors still exists in a corner of the Japanese market, my research in this article will show you that they no longer represent modern-day Japanese retail investors. The cash held in the over-the-counter FX margin accounts was ¥1.9 trillion in 2026, about 1% of Japanese households’ foreign assets.
Instead of speculative FX trading, a conventional buy-and-hold strategy is increasingly the mainstream method among retail investors in Japan. Chart 1 shows the decomposition of Japanese households’ foreign asset exposures. They rose from ¥58 trillion in March 2010 to ¥189 trillion at the end of June 2026. The bulk of the increase has happened since 2019. Investment trusts focusing on foreign equity are the largest part of their foreign asset exposure.
Chart 1

In the rest of this article, I will explain the evolution of Japanese household assets, covering both financial and real assets such as land and buildings.
Land was 54% of assets in 1990, and 21% now
Let me give you an overview of the history of Japanese household assets in the last 50 years. Except for the 1980s when a stock market bubble took hold, portfolio investment was not really a “thing” for most Japanese households. Their wealth was mostly locked in their real assets such as land and buildings. In 1990, at the peak of the real estate bubble, land held by Japanese households was worth ¥1,485 trillion, 54% of their total assets (chart 2). With houses and other buildings added, real assets accounted for 64% of their total assets. At $13 trillion using the exchange rate at the time, the valuation of real assets owned by Japanese households was roughly equal to that owned by US households, or about 50% of the world GDP at the time.
Chart 2

Real assets accounting for a large portion of household assets is not unusual. As you can see from chart 3 comparing household asset allocation among Japan, US, Germany and South Korea in 2024, real assets still account for over 60% of the total in South Korea and nearly 60% in Germany. In my view, there are several reasons real assets were the asset of choice for Japanese households until recently.
Chart 3

A household was often a small business, its land its credit
In 1972, 72% of all business establishments in Japan were run by individuals rather than companies. A household that ran a shop or a workshop needed bank credit, and banks lent against land. In FY1980 households owed banks ¥43 trillion for their businesses, about as much as the ¥44 trillion they owed on their homes. By 2009 the share of business establishments owned by individuals had fallen to 42%. As fewer Japanese households ran a business, their need for real estate as collateral declined.
Deposit rates were capped, stock market costly to use
Deposit rates were regulated in post-WW2 Japan, and they were only liberalized in steps through the 1970s and 1980s. After tax and inflation, deposits hardly earned a positive real return in Japanese history until the 1990s. Shares were expensive to buy and sell. Until 1999, brokers charged fixed commissions, 1.15% on most retail-sized trades. Equity investment trusts charged 2–3% of the amount invested just to buy. Thus a little over a fifth of households held shares until the 2000s.
Japanese households starved of investable assets in the 1990s and 2000s
When the real estate bubble burst in 1991, Japanese households had a big problem. Japan was still one of the wealthiest nations in the world, but there were no attractive assets for its households to invest in. The price of land, the trusted asset of choice until 1991, kept falling through the 1990s and 2000s, and it only bottomed in 2015 at 60% below its 1991 peak. The BoJ kept its policy rate near zero between 1995 and 2025. The domestic stock market was not appealing either. The Nikkei 225 had some ups and downs through the 1990s and 2000s, but it was not until 2009 that it hit rock bottom. Investing in foreign securities was probably the answer, but the Japanese financial industry was slow to offer efficient means of investment for retail investors. In my view, the Japanese government dithered between protecting the industry and prodding them to offer better solutions for retail investors, while I do acknowledge that some were trying hard to look out for retail investors. Reforms came in fits and starts between the 1990s and 2010s. In 1998, there was the so-called “Financial Big Bang”. Individuals and non-financial corporations became free to engage in cross-border transfers of funds. Holding companies were allowed to own banks and brokerages, so strict barriers between banking and securities were removed. Brokerage commissions were fully deregulated, which led to the rise of online brokers.
Thanks to increased competition, fees for investment trusts have been declining. As chart 4 shows, the average annual fee across all funds kept falling from 1.52% in 2001, but it has been a very slow process. The average fee of 0.94% in 2025 seems still not low enough, but as I explain later, the average hides a large difference in fees across investment funds. The most popular fund in 2026, nicknamed “All Country” with ¥13.7 trillion ($87 billion) and managed by MUFG Asset Management, charges as little as 0.06%. I will explain how low-fee funds have rapidly gained popularity in the last few years in a later section.
Chart 4

Portfolio investment has become a norm in the 2010s
As I wrote in the earlier section, portfolio investments have risen rapidly since 2019. Securities investments, including bonds and stocks, directly held and indirectly held through investment trusts, rose from ¥216 trillion at the end of 2019 to ¥484 trillion in June 2026. As a percentage of total assets, it rose from 7% in 2019 to 12% in 2026. A shift of 5 percentage points in 6 years is fairly notable. In my view, the following three factors explain the rise in the popularity of portfolio investment.
Introduction of NISA in 2014: One key factor was the establishment of NISA (Nippon Individual Savings Account) that started in 2014. In essence, NISA is a preferential tax treatment for small-sized retail investors. It exempts tax on dividends and capital gains on retail investments up to ¥18m (about $115,000). It is meant to encourage moderate risk-taking by households. For more details on NISA, please see the appendix to this article.
More availability of low-cost funds: The second factor, in my view, is a decline of fees on investment trusts. As I showed earlier with chart 4, the annual fee investment trusts charge has been declining very slowly, but the average hides a key development in the last 5 years. In 2020, funds charging less than 0.25% held 4% of the money in investment funds. By 2025, that share jumped to 26%. In my view, the availability of such low fee investment funds is a significant pull for retail investors.
Chart 5

National pension scheme no longer reliable source of funds for retirement: The third factor, in my view, is the general sense in Japan that public pensions are no longer reliable sources of income when people retire. In 2024, Prime Minister Shigeru Ishiba told the House of Representatives that the basic pension “is not meant to cover all of old-age living”, and that it is designed to be combined with the savings people build during their working years.
In the following section, I will focus on what happened in more recent years and discuss what may lie ahead in the near future.
Still buying foreign equity, but fixed income is gaining as rates rise
Japanese households are still buying foreign-equity funds
Investment trust flows show a continued appetite for investment funds targeting foreign equity. As you can see in chart 6, net inflows into foreign-equity funds, including global funds that hold some Japanese shares, averaged ¥1.7 trillion a month in the last 3 months between June and August 2026. That is the fastest since at least 2010.
Chart 6

Retail JGB sales passed ¥1 trillion a month in August
The Japanese government has been issuing retail JGBs, small-denomination bonds meant for households, since 2003. In 2026, sales of retail JGBs are surging and 2026 will most likely be a record year for retail JGBs (chart 7). In August and September 2026, their sales exceeded ¥1 trillion per month. In its FY2026 issuance plan, the Japanese government planned to sell ¥5.9 trillion of retail JGBs. At the current pace, their issuance will be closer to ¥10 trillion. It is easy to see the attraction of retail JGBs. As you can see in chart 8, retail JGBs offer far superior rates to time deposits currently being offered by banks.
Chart 7

Chart 8

In my view, the increased sales of retail JGBs by the Japanese government are a tacit warning to banks to increase the deposit rates being offered.
Time deposits are growing again
Households have long parked their money in ordinary deposits, earning minimal yields, as time deposits hardly offered any better rates. However, as banks raise the rates they offer on time deposits, households are moving their funds into time deposits. In July 2026, time deposits grew by 4.2% from a year earlier (chart 9).
Chart 9

The Japanese government is guiding money toward 1-10 year JGBs
The nudge from the Japanese government to banks to raise the time deposit rates they offer is not just for the benefit of retail depositors. As I wrote in the report told the House of Representatives that the basic pension “is not meant to cover all of old-age living”, and that it is designed to be combined with the savings people build during their working years.