Speevr logo
Report

US Yield Curve | Does Normalization Mean Anything?

Table of Contents

“I would rather have questions that can't be answered than answers that can't be questioned.”

The U.S. yield curve continues to steepen, which, according to a chart we plotted late last week, dipped back into positive-sloping territory on the 2/10-year spreads:

US Yield Curve | Does Normalization Mean Anything? | Speevr


The USD steepener was Craig’s only highest conviction call since mid-March—took a while to perform, but never really dipped into the red.  It's also positive carry. All-in-all, it has been a relatively stress-free well-performing trade, even during the market panic in early August. More on this later below.

We're unsure why yield curve normalization is only now receiving so much attention. Perhaps our data sources are unreliable, due to differences in interpolation methodology, or possibly because the Financial Times wrote about it today. Oh no, it looks as if the FT are being led Wall Street's finest.


It's a pity the folks mentioned in the FT article (above) didn't advise their clients to hold off on their big US recession call a couple of years ago until the yield curve re-steepened. There's something magical about the number zero. The US economy behaves like a Gremlin which comes into contact with water after midnight.

Undoubtedly, there will be many more grandiose macroeconomic interpretations of the significance of the shape of the U.S. yield curve. However, if you were wrong on the way in predicting a recession when the Treasury yield curve inverted, you should be less confident about making bold forecasts on the way out.

Economies and markets are inherently uncertain and rarely fit neat mathematical representations. Therefore, difference of opinion will (fortunately) always exist and decision are taken with incomplete information. But, most of issues we highlight with mainstream financial research are rooted in poorly constructed analysis which don't require domain expertize to identify.

What Does Inversion or Disinversion Signify?

Yes, yes, we all know that the yield curve sometimes inverts before a recession, later normalizing when central banks slash short-term borrowing costs to stimulate the economy. But does this really tell us anything more than the fact that the shape of the yield curve, characterized by inversions and disinversions, reflects changes (or rapid changes in expectations) on monetary policy? Or that the business cycle or gravity exist.

When Silicon Valley Bank (SVB) failed in early 2023, some people concluded that yield curve inversion discourages bank lending, which causes credit to contract and ultimately leads to a recession. Based on a study sample size of 1. It is be reasonable to presume steeper yield curves makes lending more attractive to banks provided there is an unlimited supply of willing borrowers at higher rates. In practices, it's not as simplistic. Regulation also plays a significant role.

Now let's get down to serious business…

Treasury 2s10s Yield Curve

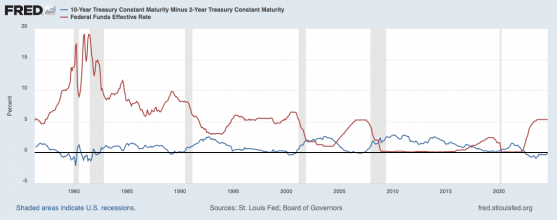
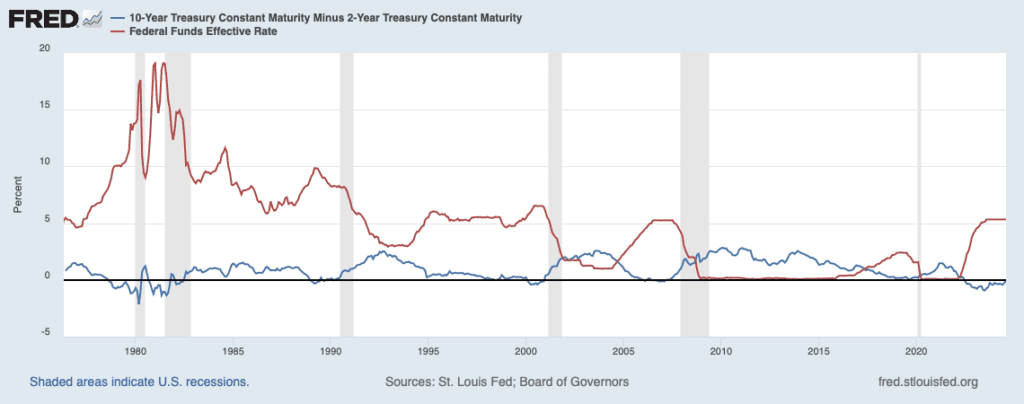
Here's a historical time series of the average monthly effective Fed Funds rate and the (constant maturity) yield spread between 10-year and 2-year Treasuries:

US Yield Curve | Does Normalization Mean Anything? | Speevr


It's tempting to create a narrative that fits our preconceptions with a quick eyeball of a chart and move on to draw conclusions.

When we consider the entirity of the data since 1976, using both absolute and relative monthly changes in the Fed Funds rate, it's difficult to draw statistically significant conclusions regarding Fed policy driving yield curve inversions or disinversions. The period we examined covers six recessions, and unfortunately, we do not have any historical information on expectations of monetary policy.

Our null hypothesis result, which some may argue is obvious (but there's a subtle difference), leads us back to Campbell Harvey's original 1986 thesis, which stipulated that the 2/10 yield curve is a 70-80% accurate predictor of a U.S. recession within the first 18 months of an initial inversion. But that's fine; the most reliable real-time market predictors are usually within that range of accuracy once accounting for false positives. In our experience, claims of 90-100% accuracy in market predictive behavior are almost always subject to in-sample overfitting, which performs poorly out-of-sample.

So far, the only thing we've proven is consistency with the original papers written on this subject in the 1980s and 1990s using new data. Which is a result in itself. A more comprehensive analysis would study the relationship between economic activity and the slope of the yield curve where data is more plentiful rather than 6-11 instances of a recession. There's surprisingly very little academic literature on this topic, perhaps due to a lack of novelty in the findings.

To conclude the first part of the discussion, the likelihood of a U.S. recession in the coming months is no more or less likely today, even though the 2/10-year yield curve is flat, compared to a couple of weeks ago when it was around -10 basis points.

Misinterpretations

Other common mistakes we've noted on this topic involve attempts to derive recession probabilities from yield curve spreads, similar to the work done by Estrella and Mishkin (1996). Implied recession probabilities can fluctuate wildly when fitting continuous processes (like the 2/10-year spreads) to a binary event with ex-post determination (a recession). Therefore, an artifact of the model is prone to literal interpretations, such as a sudden jump or decline in real-world recession probabilities. The recession probit tables in past academic papers are also presented for illustrative purposes, based on the yield curve at the time of writing, and do not adjust for absolute levels of interest rates or nonlinearities in the calculations.

Put more simply, model implied recession probabilities will differ with a flat yield curve at 1% than 10%, and so will the sensitivities to changes in slope of the yield curve.

Fed's Preferred Yield Curve Recession Gauge

According to Jerome Powell, the Fed's preferred measure of a yield curve recession risk indicator is the spread between 10-year Treasuries and 3-month T-Bills, due to its enhanced accuracy—closer to 80-90%. In practice, the 10-year/3-month spread merely reflects the difference between long-term yields set by the market (10-year) and another rate that closely tracks near-term expectations of Fed policy. It's like comparing apples to oranges rather than two interest rates set by market forces. The improved accuracy of the Fed's preferred choice of yield curve spread might also be explained by the shorter maturity on the 3-month T-Bills, where there is less economic uncertainty. Therefore, we still prefer the 2/10-year spread, even if it's less accurate, but more useful for practical purposes.

Dialing Back Ambitions

Enough pontificating over things that don't make money. For practical market purposes, the re-steepening of the U.S. yield curve means that fixed-income short risk positions and interest rate hedges become more costly to hold. There are still likely to be many swap hedges put on during the period of high inflation in 2022 that may come out of the woodwork to be unwound. Most of those hedges are still in-the-money despite the recent rally in interest rates. If this happens—though it may seem counterintuitive—the initial move could be a technical rally in long-term interest rates due to net market imbalances, possibly even (re)flattening the yield curve.

It depends on how much is made of the yield curve normalization story. Nevertheless, we can confidently say that the likelihood of a U.S. recession has not been altered in the interim, and we remain within the ~30% of instances where the 2/10-year yield curve gives false signals.

The question is whether overly optimistic U.S. inflation forecasts between 2022 and 2024 contributed to the unusually long period during which the yield curve was inverted. Additionally, would the yield curve invert if all interest rates, including overnight borrowing, were set by the market?

Updates

Okay, clearly we didn't do a good job of explaining the key difference between how we interpret yield curve disinversion versus some other market commentators:

1) The U.S. 2/10 year yield curve has been inverted since May/June 2022.

2) Historically, a U.S. recession began within 18 months from the initial point of curve inversion on 70% of past occasions. Obviously, the further we extend the look-back period, the higher the probability of a recession. It has already been more than 26 months since the yield curve inverted and remained so. This is beyond the timeframe and scope of the academic literature upon which the entire thesis rests. This is a dubious or potentially flawed assumption.

3) While yield curve inversion is not a certain predictor of a recession, the yield curve has (historically) always re-steepened to a positive slope (100%). Therefore, there is no additional information gained from yield curve normalization.

4) If there were any merit to the current claims to the contrary: i) Campbell Harvey's yield curve rule would take a different form, conditional on the timing of curve disinversion. ii) The genius economists at DB would not have been so eager to be the first bank on Wall Street to call for a U.S. recession in 2022. It's clearly “make it up as we go”, which sounds like good analysis today but seldom ages well.

5) At the time in 2022, it was very obvious that the DB U.S. economic outlook was selectively fitted to a story motivated by an otherwise empirically reliable recession indicator. Certainly far more reliable than most sell-side economists. It's better to accept reality without an explanation than to deceive oneself and clients with a perfect-sounding explanation that loses money.

In conclusion, we have not seen any credible analysis in the academic literature, or otherwise, to suggest the recent re-steepening of the U.S. yield curve carries any significance. At present, the current base case for the period 2022-2024 is within the 30% where yield curve inversion did not correctly predict a recession. New research on the topic is warmly welcomed. 

Otherwise, just pick another couple of points on the yield ‘curve' to justify the risk that's on the books.

Subscribe to receive updates from Speevr

More recent

report

Share this page

US Yield Curve | Does Normalization Mean Anything?

A historical review and analysis on the yield curve slope