Speevr logo

US Jobs | JOLTS & ECI wage inflation

Table of Contents

As mentioned late last week, today and tomorrow we get a couple of important US labor market datapoint we are closely tracking. i.e. JOLTS and Employment Cost Index (ECI) releases.

Here is how the number of job openings (JOLTS / thousands) and ECI changes year-on-year (YoY) have evolved since January 2002, when the data was first published:

US Jobs | JOLTS & ECI wage inflation | Speevr
Source: BLS


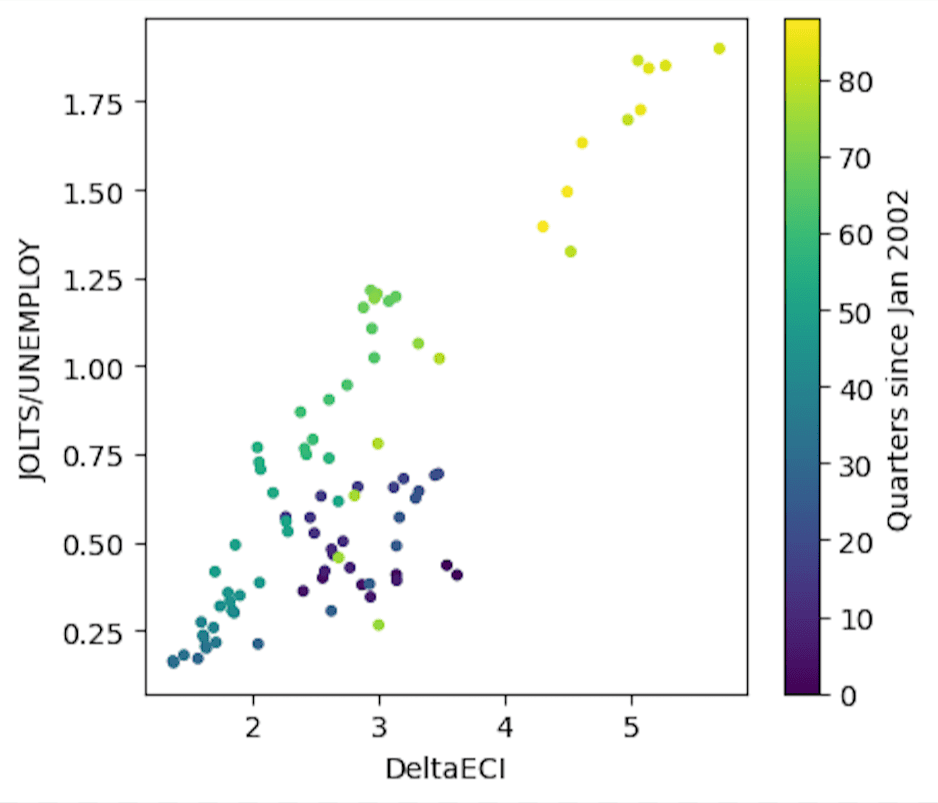
Here Beveridge curve uses the ratio of job openings to unemployment rate versus ECI:

US Jobs | JOLTS & ECI wage inflation | Speevr
Source: BLS


And the Phillip curve in the strictest definition which compares unemployment with wage inflation (not CPI or PCE inflation as is commonly done):

US Jobs | JOLTS & ECI wage inflation | Speevr
Source: BLS

Unfortunately, we don't have a sufficient amount of data to produce reliable forecasts for where the next data prints will come. However, when we look at the time-series changes when removing for exogenous shocks (GFC and COVID), there's evidence of segment trends and normal distribution statistics.

Meaning, there's a high chance the JOLTS/ECI plot continues to shift to the bottom left corner.

Work in progress.

Subscribe to receive updates from Speevr Intelligence

Most recent by Speevr Intelligence

report

Share this page

US Jobs | JOLTS & ECI wage inflation

The evolution of job openings and wage inflation