Let's start with the data…
Money market outflows
Money market funds saw net weekly outflows of ~$60bn – most withdrawals were by institutional clients. As best as we can tell, the money did not go into bond/equity mutual funds. So what happened?
Explanation 1
It's possible some money went back into the banking system as deposits which would be a positive development, and not one that we expected. Unfortunately, Fed data on bank deposits is released with a 2 week lag.
Explanation 2
The decline in assets held in money market funds is most likely from taxes paid to the US Treasury department. As such, we would guesstimate a further $50-150bn weekly decline in overnight deposits held at US commercial banks. That would not be so good!
Scenarios for US regional banks
Since we first unmasked the identity of the mystery bank on April 19th (2023) as US Bancorp (USB), the share price has steadily declined ~10%. Three possible scenarios we envisage for undercapitalized US regional banks:
1) The optimistic scenario [probability 25%]: Interest rates decline, loan default rates remain at historical lows, deposits stabilize or grow again, and some regulatory forbearance.
2) Realistic scenario [probability 50%]: Deposit outflows stabilize or marginally grow, loan default rates increase slightly to normalize, and the regulator puts pressure to raise additional capital while times are good.
3) The pessimistic scenario [probability 25%]: Deposit outflows resume, or accelerate, forcing mark-to-market losses to be crystallized. Similar outcomes to Silicon Valley Bank (SVB) or Signature Bank.
Unless one believes current market prices already reflect overly pessimistic outcomes, taken together, it's difficult to construct a bullish thesis for (non-GSIB) bank equities.
For years, the banking sector has been Uncle Sam's problem child – Unable to self-police, make money without state (central bank) subsidies, and frequently in need of bailouts. By contrast, the tech child self regulates, is independent, travels abroad, and consistently repatriates larger sums of money back home.
Is S&P 500 overvalued?
According to the WSJ, retail investors continued to invest in financial markets via ETFs in Q1 (2023). Much of the year-to-date performance in the US equity markets is attributed to Big Tech stocks. Some silly/lazy folks continue to bang on the broken drum that the rally in US blue chip stocks is due to lower (US) dollar interest rates – despite all the empirical and theoretical evidence against them.
Whether one believes stocks are currently overvalued ultimately depends on which reference points expectations are anchored upon. Yes, some analysts claim they independently arrive at their own valuations. In practice, most assumptions are heavily influenced by company earnings guidance, and other market metrics/multiples.
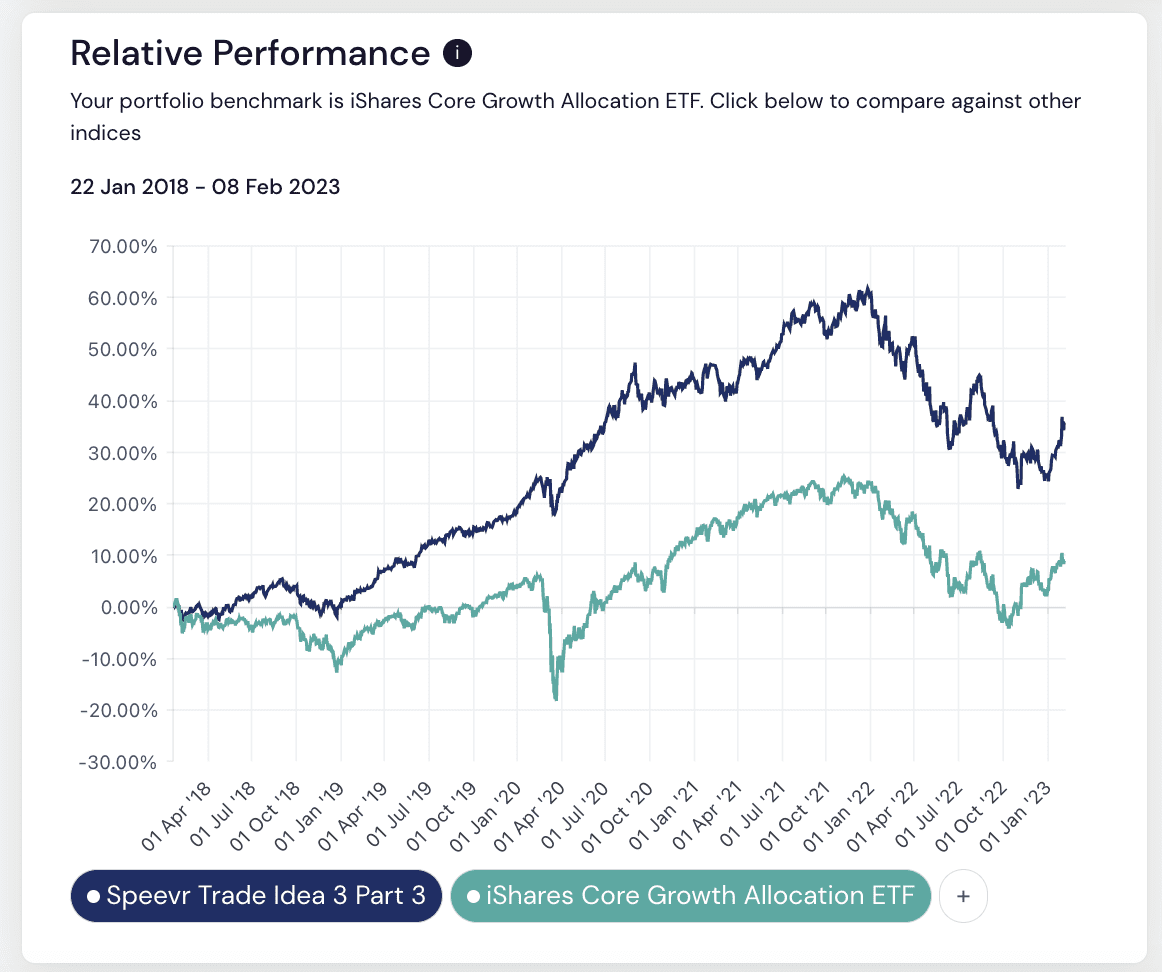
As for whether or not the S&P 500 is overvalued, it depends on whether one takes as a point of reference Big Tech stock prices at the start of Q4 2022 or Q1 2023. As previously noted by the relative underperformance in our basket of 25% Big Tech equity stocks (5% per name) paired with 75% US Treasury 10-year:


If one subscribes to our investment thesis
USA Inc = Big Tech + Fed + US Treasury,
relative US tech sector outperformance in Q1 2023 is catching up to Q4 2022 underperformance.
US tech company executives had two options to protect operating profits: i) throttle revenues by tweaking algorithms and product features, or ii) reduce costs by cutting headcount. They opted for the latter.
Big Tech operating efficiencies
For example, Twitter cut headcount from 7-8K employees to just around 1.5K. It's been reported that ad revenues are almost back up to pre-Elon Musk acquisition levels. Google is somewhere at the other end of the extreme in employee work-productivity spectrum. It should also be said that most recent advances in AI help drive operating efficiencies within the tech giants.
What's the risk of a US recession in 2023?
At the turn of the year, the median Wall Street economists' US recession probability estimates were somewhere between 65-75% with risks front loaded in H1. Based on our own statistical analysis, and examining work done by others, we determined the GS Research forecast of 35% cumulative recession probability in 2023 was the best market estimate. With the risk of entering a recession skewed towards H2 2023.
Besides the banking turmoil triggered by the collapse of SVB, the US economy has moved along the economic path we deemed as most likely at the turn of the year. Namely, the base scenario which was laid out by Jason Furman of Harvard University.
For our purposes, the state of the US economy is characterized by the first order data: GDP, unemployment rate, and inflation. Historically, the former two have mattered more in written literature. Thus far, the second order measures have proved to be unreliable predictors of future economic activity.
With almost 1/3 of the year past, and in light of pending uncertainties within the US banking system, our best estimate for the probability of the US economy entering a recession by the end of 2023 remains at around 35%. This represents a slight (absolute) increase in recession risk since the turn of the year. We’d be surprised if the economists that assigned less than 50% probably for a US recession earlier this year have materially changed their outlooks in light of the data.
While it's useful to consider a broad set of perspectives, it's better to anchor our expectations on the non-problem child of economic forecasters.
The answer to whether the S&P 500 is overvalued boils down to recession probability estimates for the two forward quarters. Based on our probability estimates and the year-to-date performance, the S&P 500 was trading cheap at the turn of the year. Now closer to fair value, perhaps, even slightly rich.
We believe the thesis presented here is more useful than those where recession probabilities fluctuate wildly based on market price action, but is passed off as ‘fundamental’ economic research.