Troy Gilchrist and Bart Hobijn
A broad dashboard of indicators is sending mixed signals about the state of the labor market. Some indicators have deviated widely from their normal historical relationships since the onset of COVID-19. Because of the uneven economic impact of the pandemic, the labor force participation rate, payroll employment, and the share of job losers among the unemployed have provided more reliable signals about overall conditions than other components of the dashboard. They suggest that labor slack is higher than implied by the current headline unemployment rate.
The unemployment rate has historically been used as the headline summary statistic for labor market conditions. Some other measures of the unmet demand for jobs, known as labor market slack, can be extracted from the common cyclical movements of a broad range of labor market indicators. Such indexes yield estimates of slack that closely follow the unemployment rate (Barnes et al. 2007, Chung et al. 2014, and Hakkio and Willis 2014).
However, since the onset of the COVID-19 pandemic, some of these measures have deviated from their historical tendency to move together over the business cycle. The resulting mixed signals make real-time assessment of labor market slack more challenging.
In this Economic Letter we show that a dashboard of 26 labor market indicators yields a level of labor market slack comparable to the 6.1% unemployment rate in April 2021. However, a different view emerges when we look under the hood to assess which indicators are better gauges of the current underutilization of labor relative to previous recessions.
We argue that circumstances specific to COVID-19 have caused many indicators to paint an overly rosy picture of the labor market. This includes indicators related to manufacturing, the pace of hiring and labor turnover, and the recovery in small business conditions.
A clearer picture emerges when we account for the unique features of the pandemic labor market that affect various indicators. The number of people who are employed is still down by almost as much as during the depths of the Great Recession of 2007–09, regardless of the much lower unemployment rate now versus then. In addition to the unemployed who are actively seeking work, four million people have dropped out of the labor force due to the lack of job opportunities, the risk of infection, and family obligations. Overall, our findings reveal that the labor market situation is worse than some headline numbers suggest.
Extracting labor market slack from many indicators
Labor market slack is the shortfall in employers’ demand for labor relative to the available supply of workers. The headline measure of slack reflects the deviation of the unemployment rate from its normal or “natural” level. However, the measure is not perfect, so it is often augmented with other labor market indicators.
We consider a dashboard of 26 indicators, which we discuss in more detail later. While these indicators each shine a light on a different aspect of the labor market, they historically have revealed a similar picture in that they have tended to move together.
Researchers rely on statistical methods to consolidate the information from these indicators into an estimate of labor market slack (Barnes et al. 2007, Chung et al. 2014, Hakkio and Willis 2014). We do the same, summarizing the common cyclical movements in the dashboard variables into two “factors” using a statistical technique known as principal components analysis.
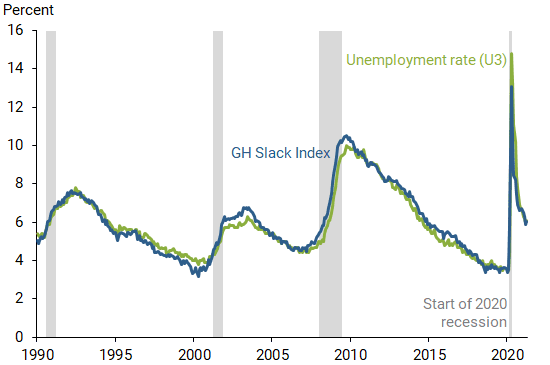
Our estimate, the GH Slack Index, is the unemployment rate predicted by these two factors. Figure 1 plots the actual unemployment rate and our GH Slack Index over time.
Figure 1
Unemployment rate and GH Slack Index

The figure shows two important results that support the validity of our index. First, our index moves closely with the unemployment rate. Second, our index estimates that slack is 6.1% in April 2021, the same as the headline unemployment rate.
Mixed signals from the dashboard
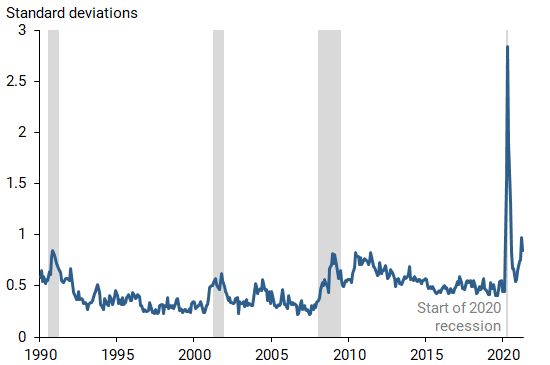
This initial comparison does not reveal which underlying indicators deviate the most from the historical comovements on which our estimate of slack is based. Figure 2 shows how mixed the signals are. It plots the portion of the variation in labor market variables over time that is not explained by the common comovements captured by the two factors we estimated using principal components analysis.
Figure 2
Unexplained variation of labor market indicators

The components of the dashboard display an unprecedented degree of disagreement about current labor market conditions. This can be seen from the spike in Figure 2 around the start of the COVID-19 recession. Even though the variation has declined substantially since May 2020, it has increased over the past few months and is higher than it ever was in the 30 years before the pandemic.
These deviations from historical patterns reflect the unique and unequal impact of COVID-19 on the labor market. They signal the need to reassess the reliability of each indicator on the dashboard as proxies of current labor market slack compared with normal times.
Reassessing labor market signals during the pandemic
Beyond yielding an estimate of our slack index, the principal components analysis also allows us to assess which indicators deviate the most from their historical patterns with overall labor market conditions. We calculate deviations of the indicators from their predicted values based on the two factors that summarize the comovements between the variables on our dashboard; we use reports from March 2021, which is the latest month of data available across all indicators. To put the magnitude of the current deviations in a historical context, we standardize them by their average historical variation.
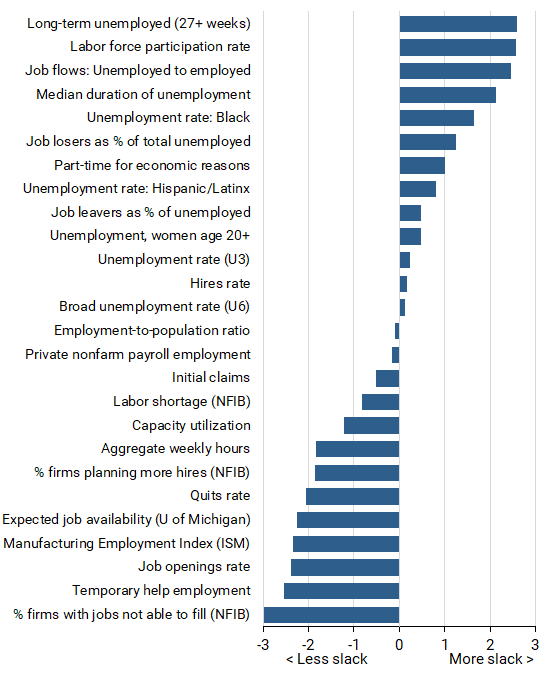
Figure 3 plots these standardized deviations, ordered from large to small. A positive deviation indicates that the measure signals more slack in the labor market than our estimate. A negative deviation suggests the opposite. For example, the small positive deviation for the unemployment rate (U3) shows that it signaled slightly more slack in March 2021 than the combination of all the indicators on the dashboard.
Figure 3
Deviations of dashboard indicators from comovement

| Variable | Deviation |
|---|---|
| Long-term unemployed (27+ weeks) | 2.59 |
| Labor force participation rate | 2.58 |
| Job flows: Unemployed to employed | 2.47 |
| Median duration of unemployment | 2.14 |
| Unemployment rate: Black | 1.64 |
| Job losers as % of total unemployed | 1.24 |
| Part-time for economic reasons | 1.00 |
| Unemployment rate: Hispanic/Latinx | 0.81 |
| Unemployment, women age 20+ | 0.48 |
| Job leavers as % of unemployed | 0.48 |
| Unemployment rate (U3) | 0.24 |
| Hires rate | 0.16 |
| Broad unemployment rate (U6) | 0.12 |
| Employment-to-population ratio | -0.10 |
| Private nonfarm payroll employment | -0.17 |
| Initial claims | -0.52 |
| Labor shortage (NFIB) | -0.83 |
| Capacity utilization | -1.21 |
| Aggregate weekly hours | -1.83 |
| % of firms planning more hires (NFIB) | -1.86 |
| Quits rate | -2.07 |
| Expected job availability (U of Michigan) | -2.25 |
| Manufacturing Employment Index (ISM) | -2.34 |
| Job openings rate | -2.39 |
| Temporary help employment | -2.54 |
| % of firms with jobs not able to fill (NFIB) | -2.97 |
The labor force participation rate as well as unemployment rates for women and for Black and Hispanic/Latinx workers all indicate worse labor market conditions than the headline number. In addition, the percent share of the unemployed who are job losers and people with a long duration of unemployment are much higher than they normally are at the estimated level of slack.
Measures related to manufacturing, the recovery in the small business sector, and hiring and labor turnover all suggest that there is much less slack in the labor market than our estimate. As we explain below, this is largely due to the specific nature of the pandemic that makes the current circumstances differ from historical patterns.
The manufacturing sector has been relatively less affected since the start of the COVID-19 recession than in previous ones. This means that manufacturing-centered labor market indicators will currently understate the amount of slack in the overall labor market. Thus, it is not surprising that temporary employment, which is largely in manufacturing, the Institute for Supply Management index, and capacity utilization rates are all sending rosier signals about the labor market than the unemployment rate.
Indicators based on the small business survey by the NFIB (National Federation of Independent Business) also indicate less slack in the labor market than is normal at a 6.1% unemployment rate. Small businesses report having a harder time hiring workers than they normally do at this stage of the business cycle. But this is because, as the economy reopens, small businesses are recruiting more than normal during this stage of the business cycle.
The current and expected future hiring to offset the outsized job losses during the pandemic as the economy reopens is also reflected in the job openings rate. Hiring is higher than normally expected relative to a 6.1% unemployment rate.
Not all hiring is coming from the pool of unemployed persons. In hard-hit sectors, like leisure and hospitality, employees who were not laid off or were quickly rehired are considered high-performing workers. This makes them a target for poaching by other employers as the economy recovers. As a result, we are likely to see an elevated quits rate going forward.
People also quit their jobs to avoid exposure to the virus or to take on responsibilities at home. This is another reason the quits rate is above where it would normally be at this stage of the cycle and, contrary to previous recessions, is not necessarily indicative of a strengthening labor market.
Because employers rehired many workers in the fall, changes in nonfarm payrolls over the past few months have been much stronger than they normally would be at a 6.1% unemployment rate, which is reflected in Figure 3. However, we are still down about as many jobs since February 2020 as were lost during the Great Recession. During the Great Recession, the unemployment rate increased 5.5 percentage points as compared to the 2.6 percentage point increase since the onset of the pandemic.
So, where have all the people who lost their jobs gone if they are not unemployed? The answer is that they have dropped out of the labor force. The combination of the simmering pandemic, bleak short-run job prospects, and family obligations at home has made many people decide not to look for work now. Since February 2020, the U.S. labor force has declined by 3.4 million individuals. This is why the labor force participation rate shows so much slack in Figure 3.
One way to augment the unemployment rate and get a better estimate of slack in the current conditions is to include those who dropped out of the labor force in the unemployment count (Powell 2021). Doing so yields an adjusted unemployment rate of 8.1%. Other measures that take into account the relative attachment of nonparticipants also indicate that the unemployment rate is substantially understating slack (Hornstein et al. 2014).
Conclusion
The COVID-19 pandemic has disrupted the U.S. labor market, causing unprecedented deviations from the normal historical relationships among a wide range of labor market variables. Indicators related to the manufacturing and small business sectors as well as to overall labor turnover suggest that there is less slack in the labor market than is reflected in the unemployment rate. By contrast, measures of labor force participation and the duration and reasons for unemployment all show more slack than the unemployment rate.
We have helped sort through these divergences by digging deeper into labor market conditions specifically related to COVID-19. Our examination of these unique features of the pandemic labor market suggests that negative signals such as the low labor force participation rate provide a better read than do the positive signals. In the current circumstances, sustained low labor force participation helps pin down the underutilization of labor that is hidden behind the headline unemployment rate.
Analysis covers data through May 11, 2021.
Troy Dolphus Gilchrist is a graduate student in Business Analytics at the W.P. Carey School of Business, Arizona State University.
Bart Hobijn is professor of economics at the W.P. Carey School of Business, Arizona State University and a visiting scholar in the Economic Research Department of the Federal Reserve Bank of San Francisco.
References
Barnes, Michelle L., Ryan Chahrour, Giovanni P. Olivei, and Gaoyan Tang. 2007. “A Principal Components Approach to Estimating Labor Market Pressure and Its Implications for Inflation.” FRB Boston Public Policy Brief.
Chung, Hess, Bruce Fallick, Christopher J. Nekarda, and David Ratner. 2014. “Assessing the Change in Labor Market Conditions.” Federal Reserve Board of Governors, Finance and Economics Discussion Series 2014-109.
Hakkio, Craig S., and Jonathan L. Willis. 2014. “Kansas City Fed’s Labor Market Conditions Indicators (LMCI).” FRB Kansas City Macro Bulletin (August), pp. 1–2.
Hornstein, Andreas, Marianna Kudlyak, and Fabian Lange. 2014. “Measuring Resource Utilization in the Labor Market.” FRB Richmond Economic Quarterly 1Q, pp. 1–21.
Powell, Jerome H. 2021. “Getting Back to a Strong Labor Market.” Remarks at The Economic Club of New York, February 10.


