We project Biden to win by 340-355 Electoral College Votes
(see below)
Why are the implied odds for a Trump victory much lower in the betting markets than those of Nate Silver's (FiveThirtyEight) model?
This may be a bit like asking why England trade at high betting odds to win the (soccer) World Cup, or the Yankees in the World Series. Unfortunately, we have no useful insights into sports betting market, so will shall focus on the stats.
Battle of the nerds
There is no better example of US political polarization than Trafalgar Group polling (right leaning) and (Nate Silver) FiveThirtyEight (left), and their respective websites. The latter accuses the former of make up their polling numbers in favor of Trump having banished them as a result. Trafalgar, points to their successful 2016 prediction (unlike Silver), whilst accusing Silver's and company of being out of touch.
So, who is right? Both… to some extent
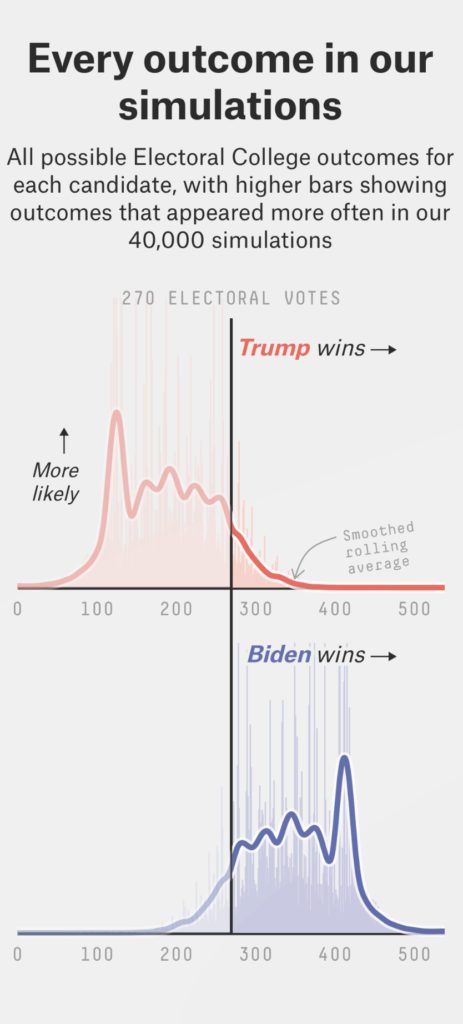 We consider the ‘Monte Carlo (MC) simulation models' by FiveThirtyEight shown here. At the risk of being overly critical… anyone with some experience of running MC simulations will see some red flags in outputs. Notably, the most commonly occurring outcome in their simulations models (mode) is for Biden to win by ~410 Electoral College (EC) votes – a huge landslide for Biden. This explains why Biden is assessed to win the EC by the 270 votes required in 95-99% of their simulations!
Without going into the details of the model, we believe the multitude of ad-hoc adjustments/variables in the FiveThirtyEight model, and the limited data available (polls) renders this approach highly flawed. To the credit of the team at FiveThirtyEight, they are very transparent on the underlying assumptions of their models.
In the FiveThirtyEight model, after calibrating with the most recent polling data, a small number of simulation outcomes show Biden winning over 800 EC votes! There are only 538 votes in total!
Pot calling the kettle black
A (far) simpler approach
To make our projections, we adopt a far simpler (and hopefully more intuitive) approach using merely aggregated polling data and some pre-college level statistics. We are capable of doing more complexity analysis if required. However, simplicity is the key to a useful model.
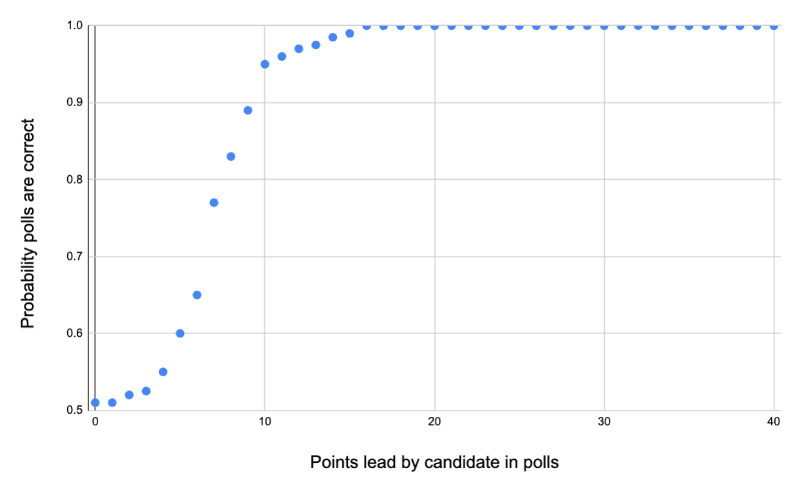
Above is the only fudge we make in our model – a sigmoid function commonly used in machine learning. All this says is if the recent state polls are too close to call we assign 0.5 probability tp the final outcome. Over +15pts leads by a particular candidate we assume to be a certain outcome with probability 1. Between 0-10% is where our assumptions should (and must) be challanged.
The benefit of our approach is to ensures the model is internally consistent and never yields outcomes that exceed 538 EC votes. (Moreover, the environmentally conscious amongst us should be happy for the many hours of computation power saved.)
First we consider the states with the highest source of statistical risk to include this weekends tsunami of polls released – as we have done previously.
States with highest risk of a surprise outcome
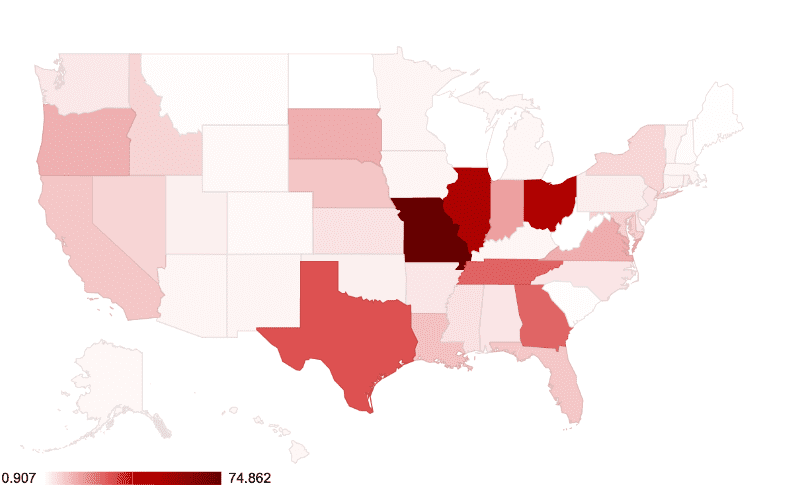
Risk score
Accounting for population size, the total number of polls, and a candidate's marginal lead, we identify MO, IL, IN TX, GA, and OH States as the hotspots for surprises.
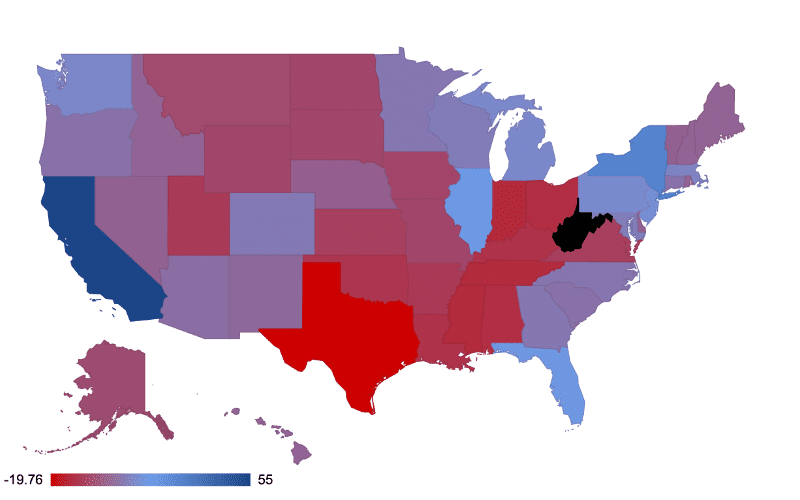
Blue – Biden points advantage Red – Trump points advantage
Black represents states with no reliable public polling data available in 2020
Above we have probability weighted the number of votes in each state. However, this does not capture the polling uncertainty in each state. For example, Biden's +55pt votes expected from CA is by far more secure (100%) compared to Trump's +20pts (out of a total of 38pts for the eventual winner). Yes, we know it's an all or nothing situation so please stay with us!
EC votes at risk by state
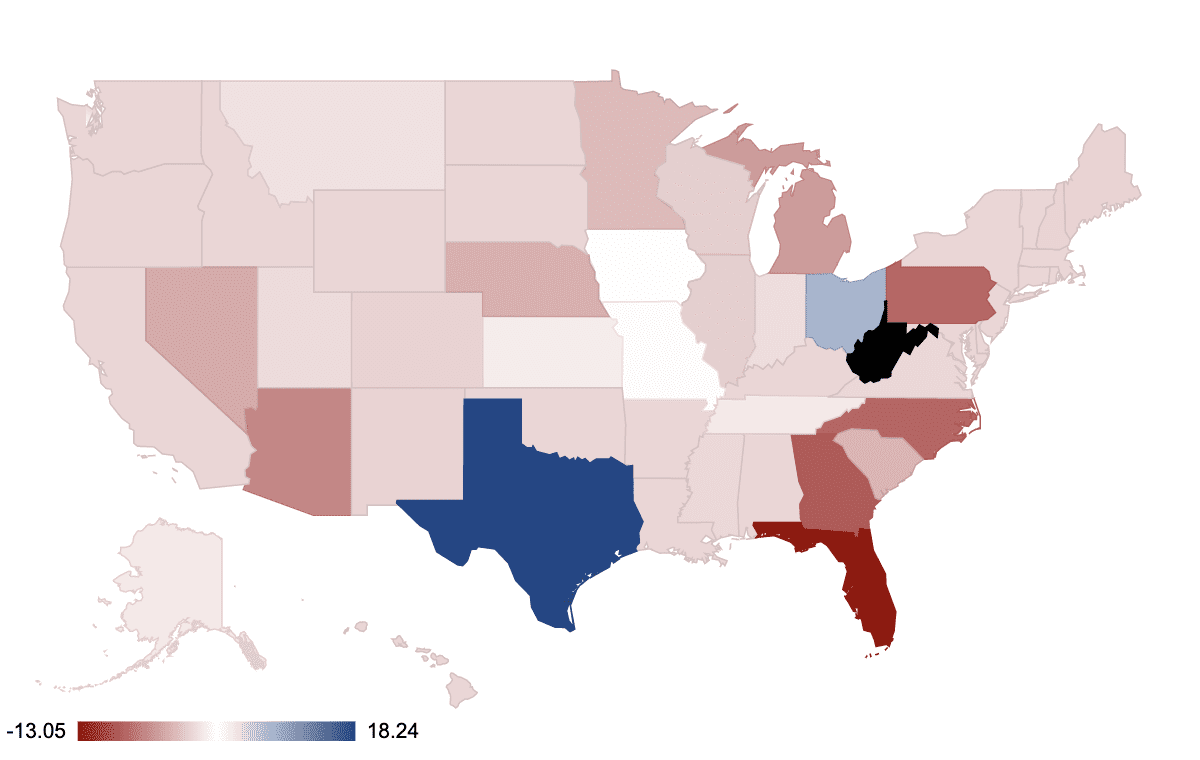
Black represents states with no public polling data found in 2020
Above represents the points still to play for in each state. This helps us better visualise what is at stake for each candidates . It is also useful to keep track of our ‘rubbish in and rubbish out' of the model. [For the statistically literate, this is approaching the Central Limit Theorem which serves as a North Star when summing over the collective sources of statistical error.]
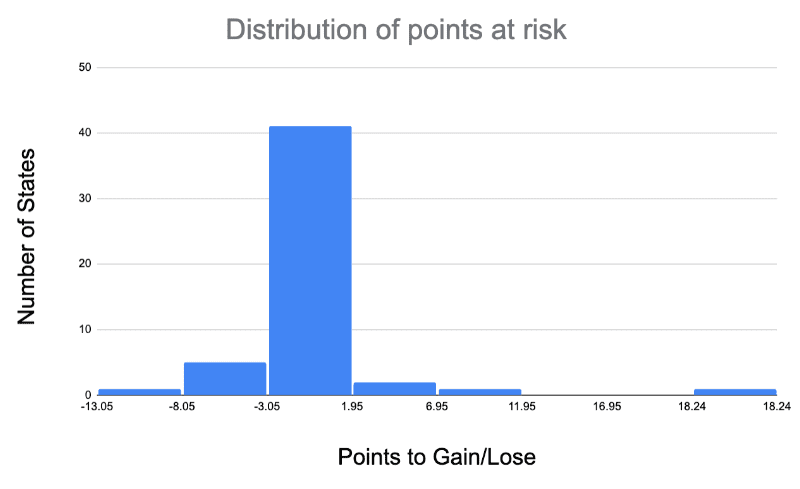
We see (above) our uncertain votes are not sufficiently distributed to impact our model (uncorrelated).
Summing up the weighted average votes for each candidate we have:
| Electoral College Votes | Trump | Biden |
| Model Adj | 198 | 340 |
| Non – Adj | 183 | 355 |


Identifying the Opportunities of The AI Buildout (Part 1)